Leaderboard


Popular Content
Showing content with the highest reputation on 08/20/2025 in Posts
-
Sounds like the perfect guy to give a QO to. If he accepts, a one year insurance deal. Decline and draft pick.3 points
-
Morton took a nap and is now rested.3 points
-
3 points
-
umpiring has gone completely to **** here.3 points
-
The runner's lead hand hit Dingller's glove before hitting the plate.3 points
-
Can we fire Harris for his horrible trade deadline yet?2 points
-
Great job by Morton to save the inning and protect a still-big lead. 7-2 Tigers, mid 5.2 points
-
Full throttle. Pedal to the metal. No prisoners. We love the smell of napalm on a nice afternoon. Houston, you have a problem. Hasta la vista baby.2 points
-
https://www.nhl.com/news/detroit-tigers-players-wear-sergei-fedorov-jerseys-to-ballpark Pretty cool! AWood threw this up yesterday, he was so fun2 points
-
I’d prefer to imagine that with the last 4 days of scorelessness2 points
-
I know some people thought that complaints earlier in the season about empty seats behind home plate were silly, but c'mon, the crowd cheering the ball four added to the occasion. As did the mist.
 2 points
 -
Everybody is talking about the play at the plate but don't forget the Perez catch in CF. The 2nd inning, I think.2 points
-
Cue the Rolling Stones2 points
-
Al2ve for the price of one!2 points
-
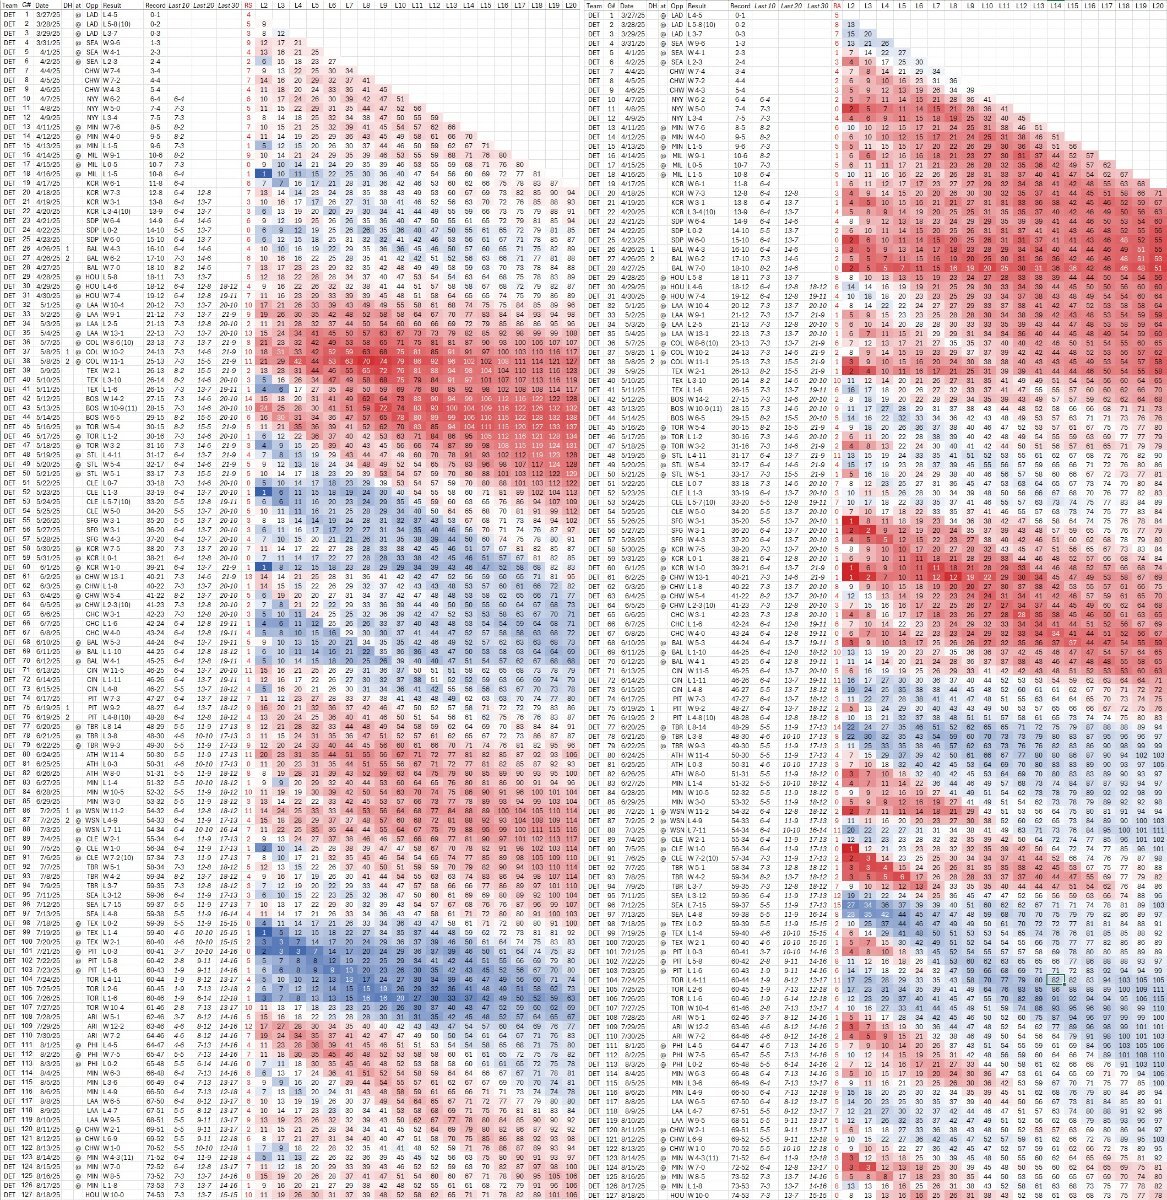
Because I am retired and I have not only a lot of time on my hands but a ton of Excel skills I want to continue wielding, I put together a graphic representation of how the Tigers have scored runs and allowed runs in game streaks between two and 20 throughout the season. Using Baseball Reference, I downloaded a list of all games played by all 30 teams through yesterday (August 19). Then I created two tables, one for runs scored (offense) and another for runs allowed (pitching and defense). I added columns in the middle of each table to reflect season win-loss record along the way, as well as records for streaks of 10, 20, and 30 games, pretty much as you see within standings tables on Reference itself. Then I created additional streak columns at the end of each table for last two games through last 20 games, to reflect runs scored and runs allowed during those streaks. You can easily figure out what's what by looking at the column headers at the top. Then, to make it easy to see whether the Tigers have scored/allowed a lot of runs versus a few runs in the last X games, I color-coded each box to show whether the Tigers did well in the past X games (the redder, the better) or did poorly in the last X games (the bluer, the worse). White boxes reflect average runs scored/allowed. The numbers in white means those streaks were at the extreme 1% percentile at either end of the spectrum, meaning the most (or fewest) runs of any team for that streak length throughout the season. I'm basing these colors on the average of runs scored/allowed in each set of X games throughout the season by all 30 teams. The analytical cognoscenti among you might notice that I am using standard Statcast colors on this table. Hopefully, that's enough explanation for you to figure out what's what. So here they are, side by side, with the runs scored table on the left, and the runs allowed table on the right. Just remember that for each table, redder is better (more runs scored, fewer runs allowed), and bluer is worse (fewer runs scored, more runs allowed): Yeah, it's really hard to read the numbers within the post, so if you want to see the actual numbers, my advice is to click on each table to see those tables expanded in your browser. But even if you don't expand the tables, you can tell by the colors how well the Tigers did in streaks of anywhere from 2 to 20 games throughout the season. You can see how the month of May was "peak Tiger" on both sides of the ball, but you might be surprised to see by the gaggle of white numbers showing that during early May, the Tigers had among the very best offenses of any team during the entire season for long stretches of games. Did you remember that during the 12 games between May 1 and May 13, we scored in double digits six times, and at least eight runs eight times? I didn't remember exactly that until I saw this! Then you can see how the offense went colder than average from late May into mid-June, but our 30-game records were still in the .600 to .700 range because our pitching was redder than average during the same time. But then it flipped around from Mid-June into early July, when our offense got redder while out pitching/defense got bluer, and yet, we still maintained close to a .600 winning percentage over a series of 30-prior-game chunks of season. Then you can see where it really falls down in late July, which is a sea of blue on both tables. That's where all the losing really came from, and you won't be surprised to be reminded that it was the offense that really went splat, but the pitching/defense was also well below average, taken against all other teams for the entire season and their performance for streaks of similar length. And the happy ending to this post is the red at the bottom that has crept back into both the run scoring and run prevention. Well, this was fun way to kill a morning. 😃
2 points
-
Comerica Park - Detroit, MI Listen: 97.1 The Ticket Watch: FanDuel Det Game Time Forecast: 72 Partly Sunny LHP Framber Valdez RHP Charlie Morton
1 point
-
Great—now I have to break out a dictionary. Your posts are becoming increasingly difficult for me. I yearn for the simplicity of your 6 runs requests.1 point
-
I still feel pretty good about this post.1 point
-
1 point
-
Tigers beat Astros, 7-2.
1 point
-
Several of us are going to be that guy three years from today. I can think of a few of us who won’t.1 point
-
Great story, great memory.1 point
-
So a few minutes ago, the TV crew named Luke Putkonen their random Tiger of the Day, and provided a few factoids, but not what I think is the most interesting one: he was the guy who threw the walkoff wild pitch in Miami during the Henderson Alvarez last-game-of-the-season no-hitter against the Tigers in 2013. Even better, Alvarez was on-deck to hit when it happened, surely making him the only pitcher in history to win a no-hitter while standing in the on-deck circle. He would never have even stepped to the plate, though: bases were loaded with two outs in the bottom of the ninth, so there was either going to be an out to end the inning, or a run to win the game.1 point
-
Bob Gibson would have done it with a first-pitch fastball.1 point
-
Good points all, and it’s even worse than that: if a starting pitcher fails to go at least five full innings—if he pitches 4-2/3 innings of shutout ball, then leaves with the lead that’s never relinquished—then he is, by rule, ineligible for the pitcher win. So the official scorer is forced to assign the win to some other pitcher who didn’t pitch as long or as effectively, which is exactly what happened here. It’s beyond asinine. What really got me to start questioning the value of pitcher wins altogether was the season Nolan Ryan had in 1987. He led the league in ERA (2.76) and strikeouts (270), placed fifth in Cy Young voting—and finished with a “record” of 8-16. By pitcher record, he was terrible. By actual performance, he was arguably the best starting pitcher in the league. What else did I need to know?1 point
-
The screams just suck. But, i'm guessing someone gets a stiffy from this.1 point
-
Might as well.1 point
-
I don't like hurting someone named Trammel in Detroit.1 point
-
Might as well get six this inning.1 point
-
Watching Charlie Morton in a Tigers uniform reminds me of Kevin Costner in For The Love of the Game.1 point
-
Charlie Morton’s brief talk with Daniella was revealing about the way AJ can manage players although I doubt he has a one-size-fits-all “plan.” Morton actually got pretty serious as he talked about joining the Astros when AJ was Manager, and how he actually treated him like a person instead of as an object or a function. I’m interpreting here, but I’m pretty sure this is what he meant. That’s something he wasn’t used to, except maybe when he was in the minors. My guess is AJ has an idea of the players he can get reach on a personal level to motivate, and those who its best to have some distance from because that is their particular comfort level. Players are not entirely expressions of statistical functions, which is something measurable, and apparently the part that isn’t reducible to that is manageable and can be motivated at least in AJ‘s eyes.1 point
-
Initial reporting about McGonigle was 'he'll be a 2B at MLB at best". More recently people say he might be able to stick at SS. But the Tigers have a long history of telling us we have great defenders in the minors who turn out to be not-so-much when they get here (Kriedler, Jung etc). They're playing him exclusively at SS so far this season, so they are trying, but we probably won't find out for real if he can cut it as an MLB SS until he gets here.1 point
-
Probably had a lot to do with the novelty of night games, as the next day the two teams drew under 10,000 for a Saturday day game. The first night game at Tiger stadium had been just 7 weeks earlier on June 15, 1948.1 point
-
I just think the whole concept of winning and losing pitchers should be dropped all together. I mean even if we look at complete game situations there's still stupid stuff that can happen: Monday Pitcher A throws 9 innings, gives up 8 runs, but the offense exploded late in the game and scored 10 runs. Pitcher A gets a "Win." Tuesday, Pitcher B throws 9 innings giving up just two run, one of them because of a fielding error. But the offense was totally shut down that day and only managed one run. Pitcher B gets a "Loss." Over a full season, and more so of a full career, then a good pitcher will probably end up with a good W/L record and a bad pitcher will probably end up with a bad W/L record, but only in probably and only generally speaking. There are way too many other variables... A perfect example of this is our old friend Jeff Weaver. In 2002 with Detroit Weaver had an ERA of 3.18 and a WHIP of 1.192 but had a 6-8 W/L record in 17 starts. Then he was traded to the Yankees mid season. With the Yanks in 8 starts he had a 5-3 record. Does that mean he got better when he went to the Yankees? Well, the stats say no. His ERA with the Yankees was 4.04 and his WHIP was 1.231. Defense, Run Support, Who you end up pitching against... these are all variables that are way outside of the pitcher's control yet drastically effect the W/L record. It's a dumb stat that at best tells you a good career W/L probably tells you the pitcher was better than average.1 point
-
And here’s that game: https://www.baseball-reference.com/boxes/DET/DET194808060.shtml Ted Gray was the winner, Walt Masterson the loser. Both pitched a complete game. The Tigers drew over 29,000 to Briggs Stadium on a random Friday night in August to see two sub-.500 teams battle it out. That’s post-war and post-Depression exuberance for you. As with last night’s game, this game featured an outfield assist at the plate, albeit in the sixth inning for this game, and with a bit of a rundown between home and third. Here’s a “replay” of the game if you’re interested in seeing that kind of thing: http://backtobaseball.com/playballregularseason.php?page=0&IDindex=DET1948080601 point
-
Might as well sweep the series1 point
-
I get that frustration, I may not be 60 but I want them to win the Super Bowl this season as much as anybody else. But I’d also like to compete next season, and the following season, and the one after that, and so on. If you have ten years with a roster that looks like the Lions have had the last three years, you’re bound to win one eventually, and you may just happen to win more than one. Putting the eggs in a single basket opens you up to one Divisional Round exit after the entire defense gets hurt and your outgoing OC calls a WR pass in the most important game of the season. And then what?1 point
-
Tigers still with the best record in the league, 8-2 in their last ten, 15-7 since the horrific swoon. i think we’re back on the horse.1 point
-
The tariffs on trash cans are really taking a toll on the citizens of Houston1 point
-
1 point
-
Jahmai Jones is decidedly not Javy Baez. Didn’t offer at any of three yakkers and draws the walk.1 point
-
Score a fake run dummies1 point
-
Feel bad laughing but that was funny1 point
-
That Skubal throw to first … just … yikes.1 point
-
hopefully that's the end of Brown for the night and we can get into the Astros' exhausted bullpen.1 point
-
To me this is a great game. Obviously frustrating, but Hunter is also a stud.1 point
-
The beauty of a 0-0 game like this would be hard to explain to someone who likes cock fighting and mud wrestling.1 point
-
1 point
-
1 point
-
My favorite TV pairing is Jason and Carlos Pena. Carlos has a knack for concisely discussing the finer points of hitting. Plakata!!1 point


_svg.thumb.png.0f31c1a45cf5099c3923e98f7c63216b.png)